
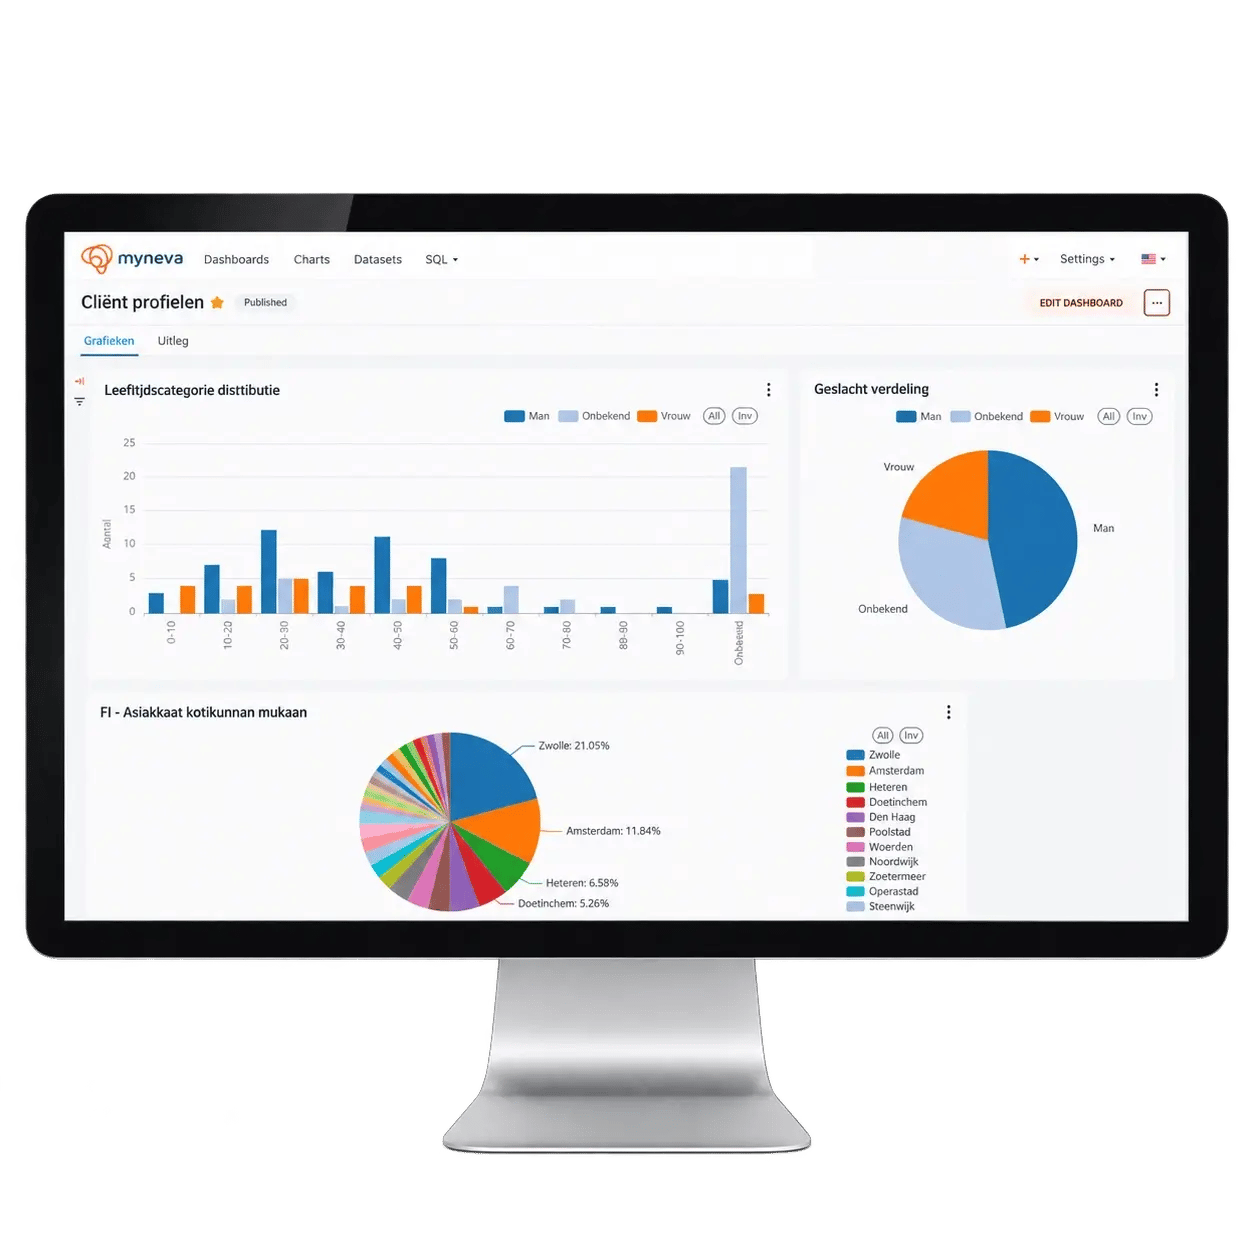





Support managers and teams with AI-supported data analysis that transforms complex data into clear, actionable insights. This creates greater transparency, which serves as the foundation for more informed decisions in daily work.
Data sets can be searched flexibly and analyzed independently without any prior technical knowledge. This speeds up the process of gathering information and creates greater transparency.
Data is presented in customizable charts and graphs. This makes complex relationships easy to understand at a glance and facilitates decision-making.
Categories and variables can be filtered based on specific questions. This keeps the focus on relevant information and makes analyses more efficient.
Tables, filters, and charts can be combined into a single dashboard. This provides a comprehensive overview and highlights the relationships between key metrics.
Key performance indicators can be tracked and compared over defined time periods. This makes trends easier to understand and allows for proactive planning of measures.
Trends are systematically tracked, analyzed, and visualized. This makes critical developments visible earlier, allowing organizations to take targeted countermeasures.
Reports can be created independently and flexibly adapted to new requirements, enabling a faster response to changing reporting needs.
External data sources can be connected via standardized APIs and consolidated on a single platform. This ensures consistent data for analysis and reporting.
As part of the myneva Care Platform, myneva.analytics builds on the data your teams already record – without separate data projects or additional IT effort.
The information documented in daily care automatically flows into myneva.analytics without the need for manual export.
Specific data models structure the data and make it immediately usable.
Key metrics, trends, and deviations appear in interactive dashboards – based on existing templates or your own analyses.
Managers and teams can identify areas requiring action, plan measures, and make more informed decisions.
Whilst care professionals focus on providing care, myneva.analytics works in the background: dashboards automatically compile relevant key performance indicators, and reports for external audit bodies are available at any time.
Up-to-date insights highlight where there is a need for action in everyday care – enabling more targeted measures and improving the quality of care.
Key metrics, trends, and deviations are displayed in interactive dashboards. This provides a reliable foundation for operational and strategic decisions.
Standardized data models and ready-to-use dashboards reduce the effort required for data preparation and reporting. Business units can generate reports independently, without additional IT support.

Your digital assistant for modern admissions and occupancy management: saving up to 80% of administrative time in the admissions process.
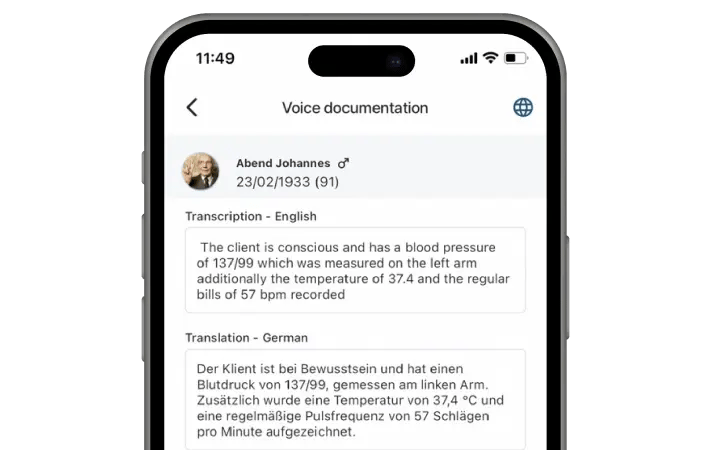
Your digital assistant for integrated voice input: documentation directly at the point of care – saving up to one hour per shift.
Your digital assistant for relatives management: more time for care through the digital integration of relatives and clients.
The smart care facility is no longer a vision of the future. Self-service analytics helps care organizations use data effectively, simplify processes, and noticeably relieve care professionals in their daily routines.
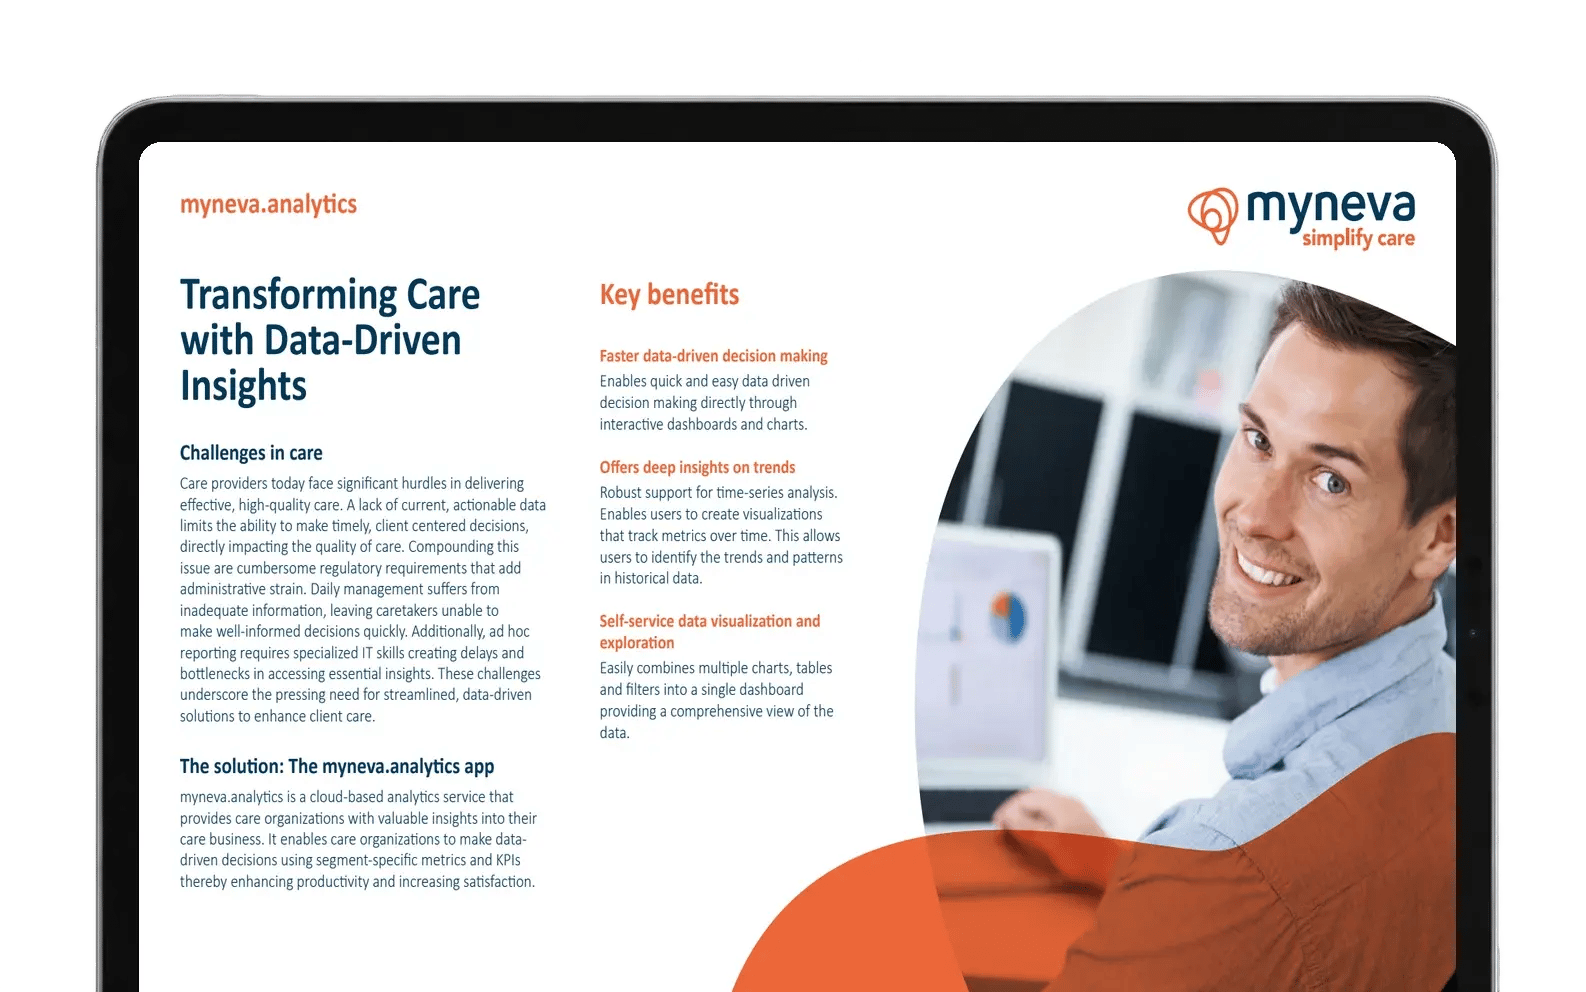
Learn more about the specific benefits and features that myneva.analytics supports your organization with.
myneva.analytics works with the myneva core products for elderly care, social care, child and youth welfare and disability support. The data documented there flows into the analyses automatically. Which key figures are available depends on the core product in use.
No, dashboards and reports are designed for self-service: ready-made templates get you started, and evaluations can be adapted without prior technical knowledge or a request to IT.
Data is processed in compliance with GDPR and stored exclusively in the EU. Access to data is logged, which supports regulatory reporting requirements.
Yes, standardised APIs let you connect external data sources, so myneva.analytics can serve as the central reporting solution for your organisation.
Implementation builds on standardised templates and requires no additional IT effort. Schedule a demo and we will show you which dashboards fit your organisation.
Schedule a demo and learn how myneva.analytics transforms your existing data into clear, actionable insights.